Zahiruddin Zahidanishah
Engineer/Data Visualization
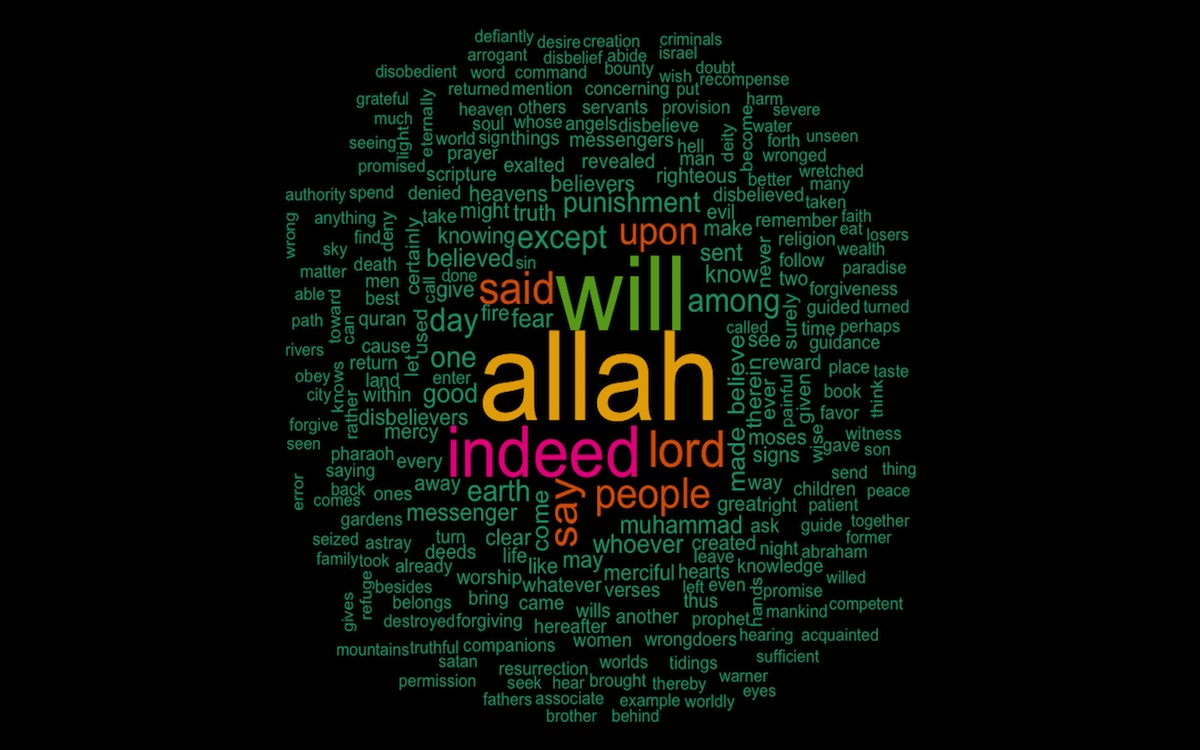
This website showcase data analysis and visualisation projects using open source programming such as Python, Pandas, Plotly, Jupyter Notebook and Streamlit.
For the main dashboard pages please click here.
Should you required assistance on the codes for the charts and tables, please feels free to contact me through my Email accordingly.
For more details on the author knowledges and experiences, please click on the resume.
Daily updates on the status of Covid19 pandemic especially in Malaysia and selected countries around the world.
The web application for Malaysia Covid91 Cases dashboard can be view here.
Reports and analysis on electricity usage and consumption for a typical resident house.
The web application for the electricity dashboard can be view here.
Reports and analysis on water usage and consumption for a typical resident house.
The web application for the water usage dashboard can be view here.
Reports and analysis on Malaysia 14th General Election.
Texts analysis using R programming Language.
Analysis on currency exchange using Python and Jupyter Notebook.
Analysis on movies database using R programming Language.
Pandas cheat sheets for easy reference.
Matplotlib cheat sheets for easy reference.
Plotly colors codes cheat sheets for easy reference.